flowchart LR
    A[Diagramming] --> B[Identify Threats]
    B --> C[Counter Measures]
    C --> D[Evaluate]
    D --> A
Threat Modelling
Martin Ertsås
2024-05-23
Whoami?
Introduction
Why are we doing threat modelling?
- Learn something about our system
- Identify threats
- Identify business impact of threats
- Identify severity of threats
- Prioritize threats
- Mitigate threats
Theat Modelling Manifesto
- A culture of finding and fixing design issues rather over checkbox compliance
- People and collaboration over process, methodologies and tools
- A journey of understanding over a snapshot
- Doing threat modelling over talking about threat modelling
- Continuous refinement over a single delivery
Threat Modelling Stages
- Diagramming
- Identify Threats
- Counter Measures
- Evaluate
Threat Model Lifecycle
- Diagramming - What are we building?
- Identify Threats - What can go wrong?
- Counter Measures - How can we prevent it?
- Evaluate - Did we do a good enough job?
Diagramming
What is diagramming
- Define scope
- Understand objectives
- Create doomsday scenarios
- Who interacts with the system?
- High-level overview of system with actors
- Dig into single scenario/component of system
Doomsday scenarios
- Who gains illegitimate access?
- What do they do to the system?
- How does this impact our business?
Example
| Attacker | High level Attack Scenario | Business Impact |
|---|---|---|
| Script Kiddie | Blocks traffic to server | Loss of reputation Support requests |
| State Actor | Upgrades device with modified source code | Customer data loss Fines Revocation of operating licenses Loss of reputation |
TASK!!!
Create 3 doomsday scenarios as a group
- Everyone writes down 2 potential doomsday scenarios
- Select top 3 together
Diagram Levels
- Context Diagram
- Feature/Component Diagram
- Sub-Component Diagram
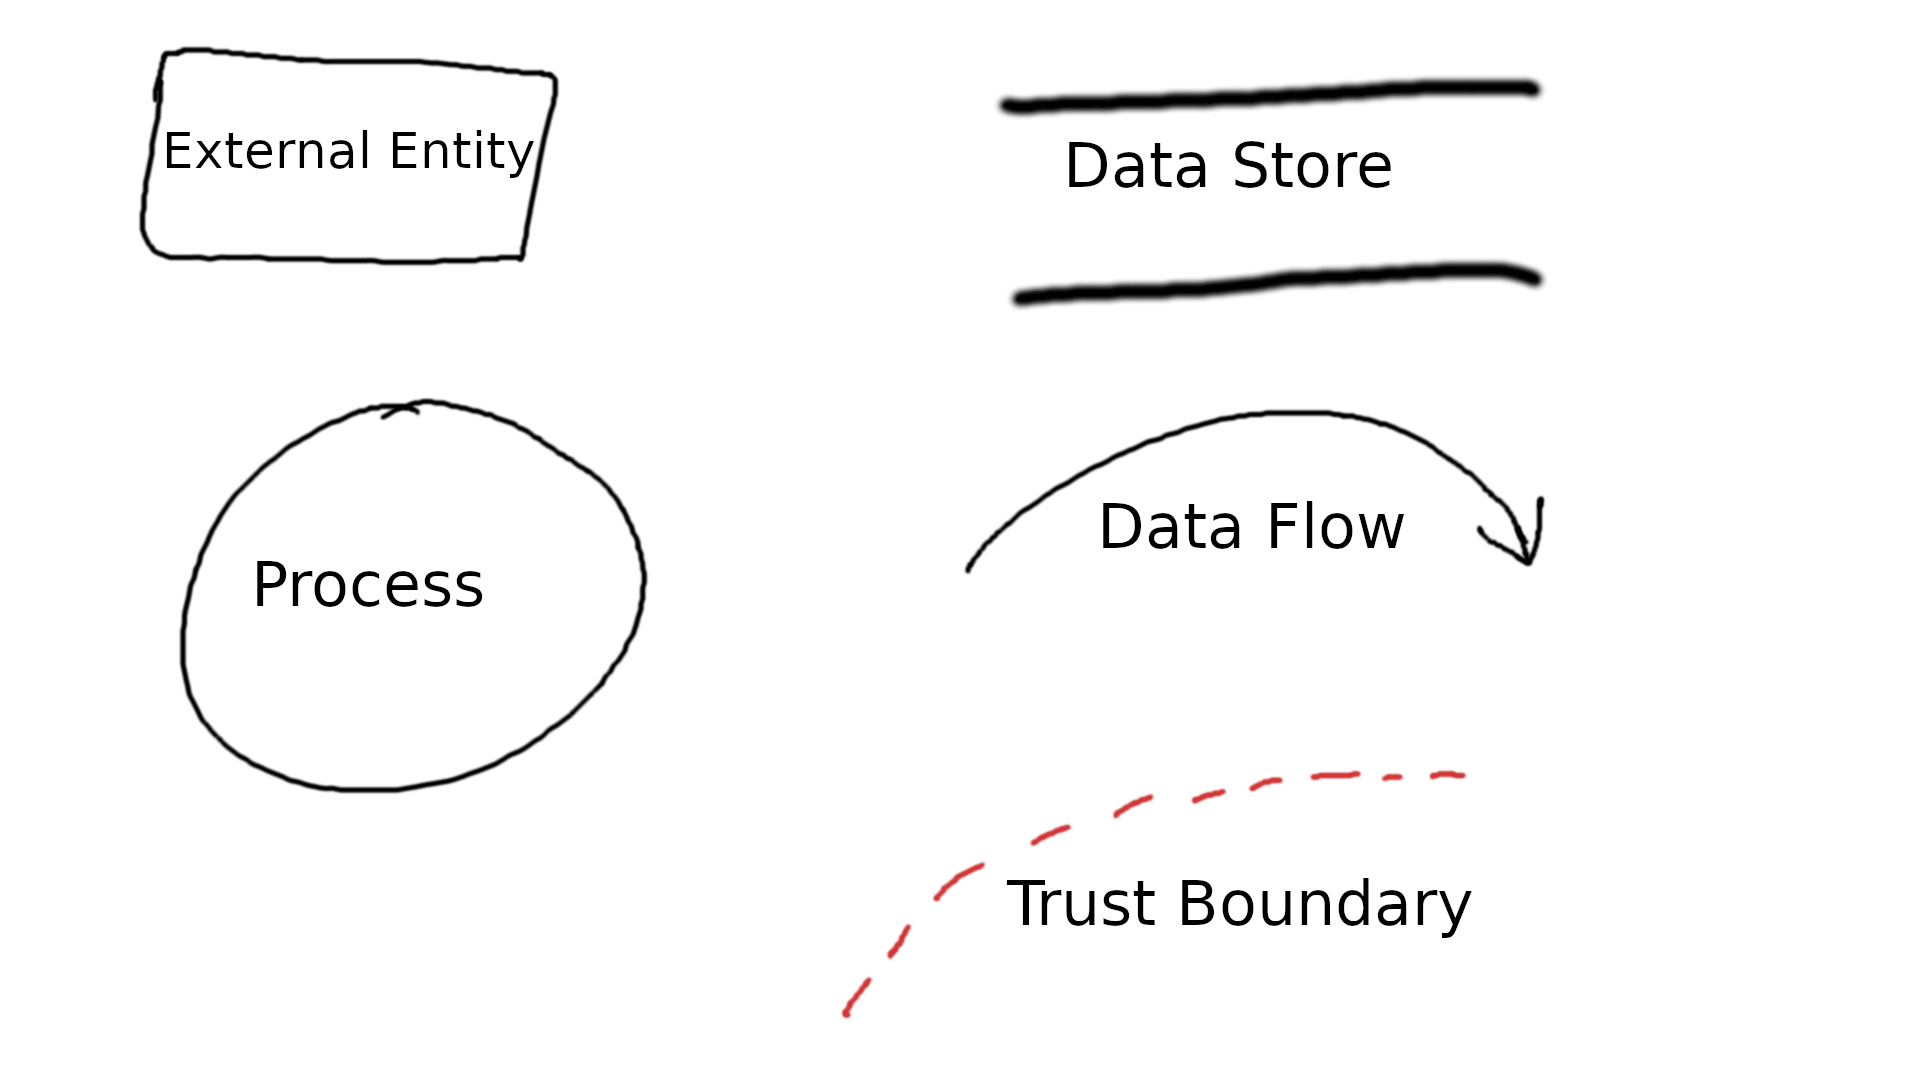
Diagram elements
Context Diagram
- Identify main data flows
- Identify actors
- Identify main trust boundaries
- Identify traffic type
Context Diagram
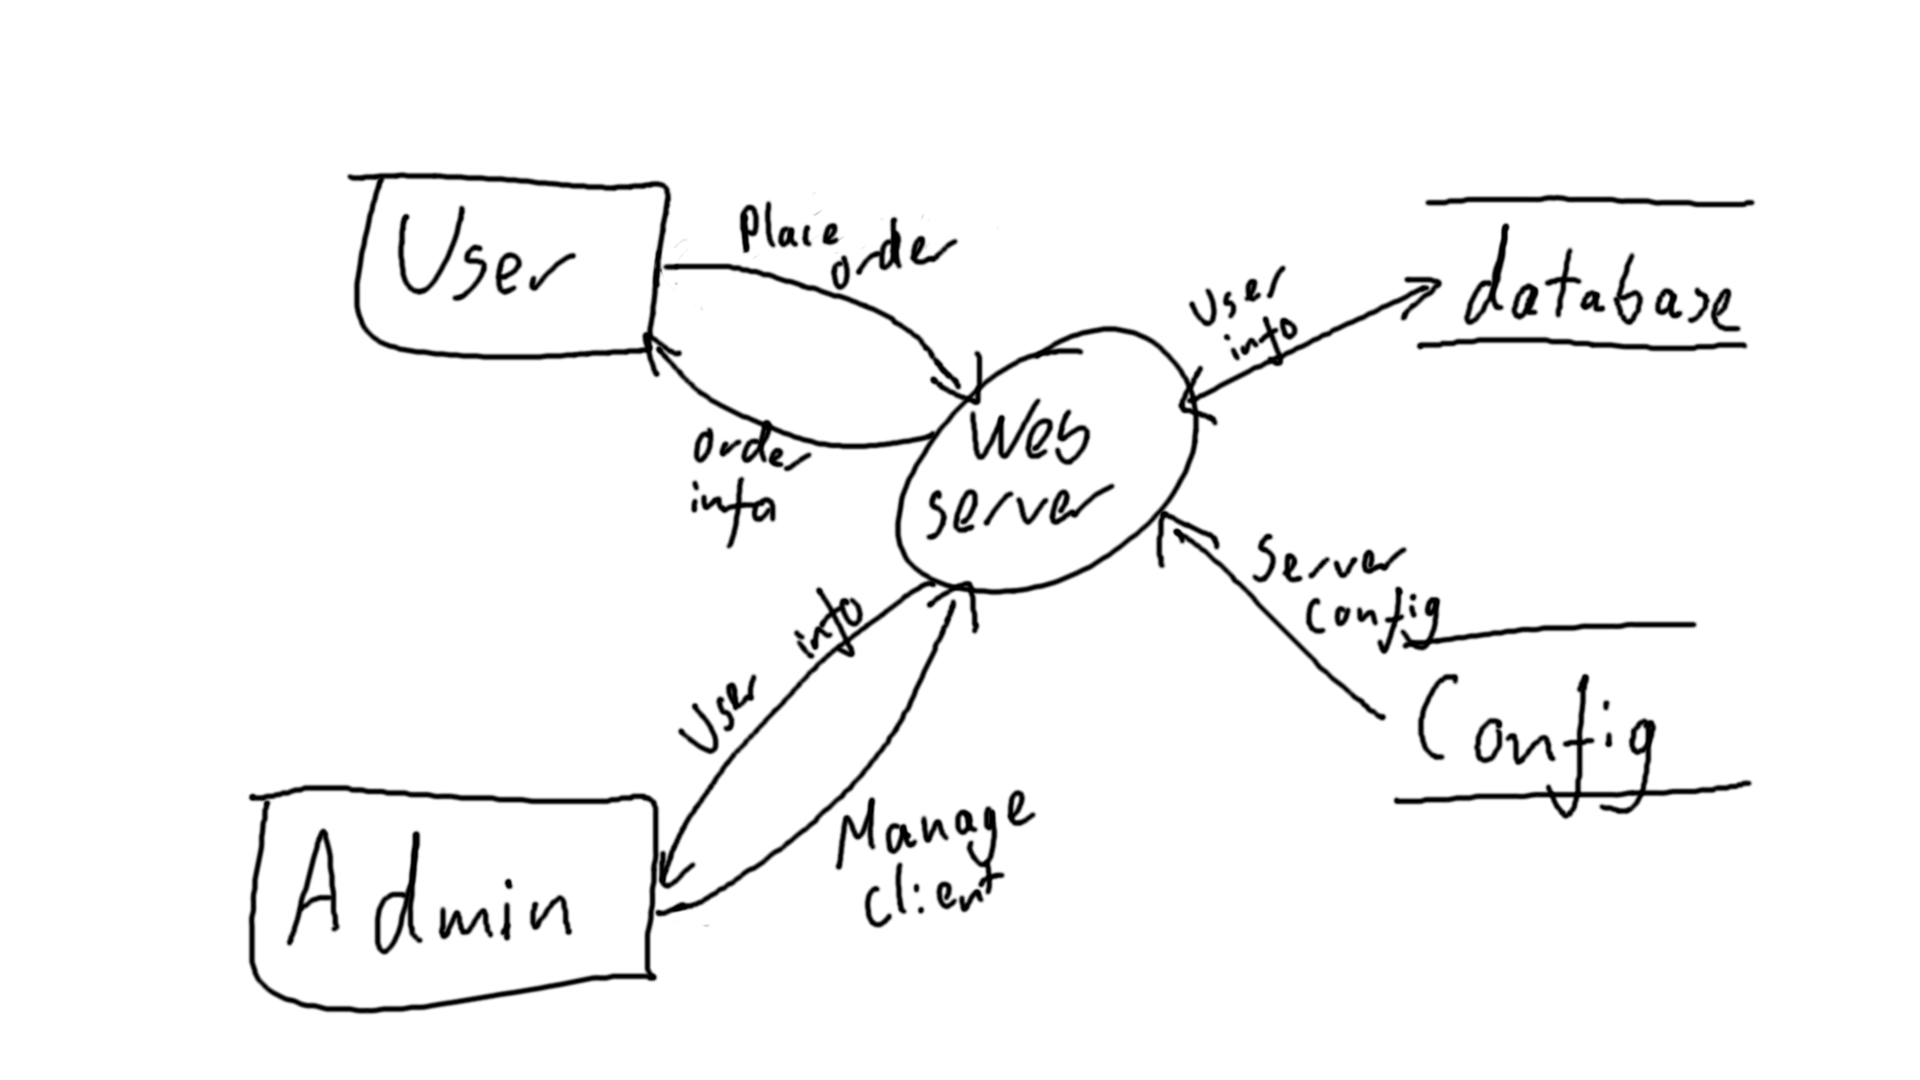
Context Diagram
Component diagram
Deeper dive into a component or feature. Can go several levels down.
- Identify traffic into and out of the component
- Identify actors on the component
- Identify trust boundaries
- Identify traffic type
- Identify transport type
TASK!!!
Create a context diagram for your system
- Identify main actors
- Add main data flows
- Identify main trust boundaries
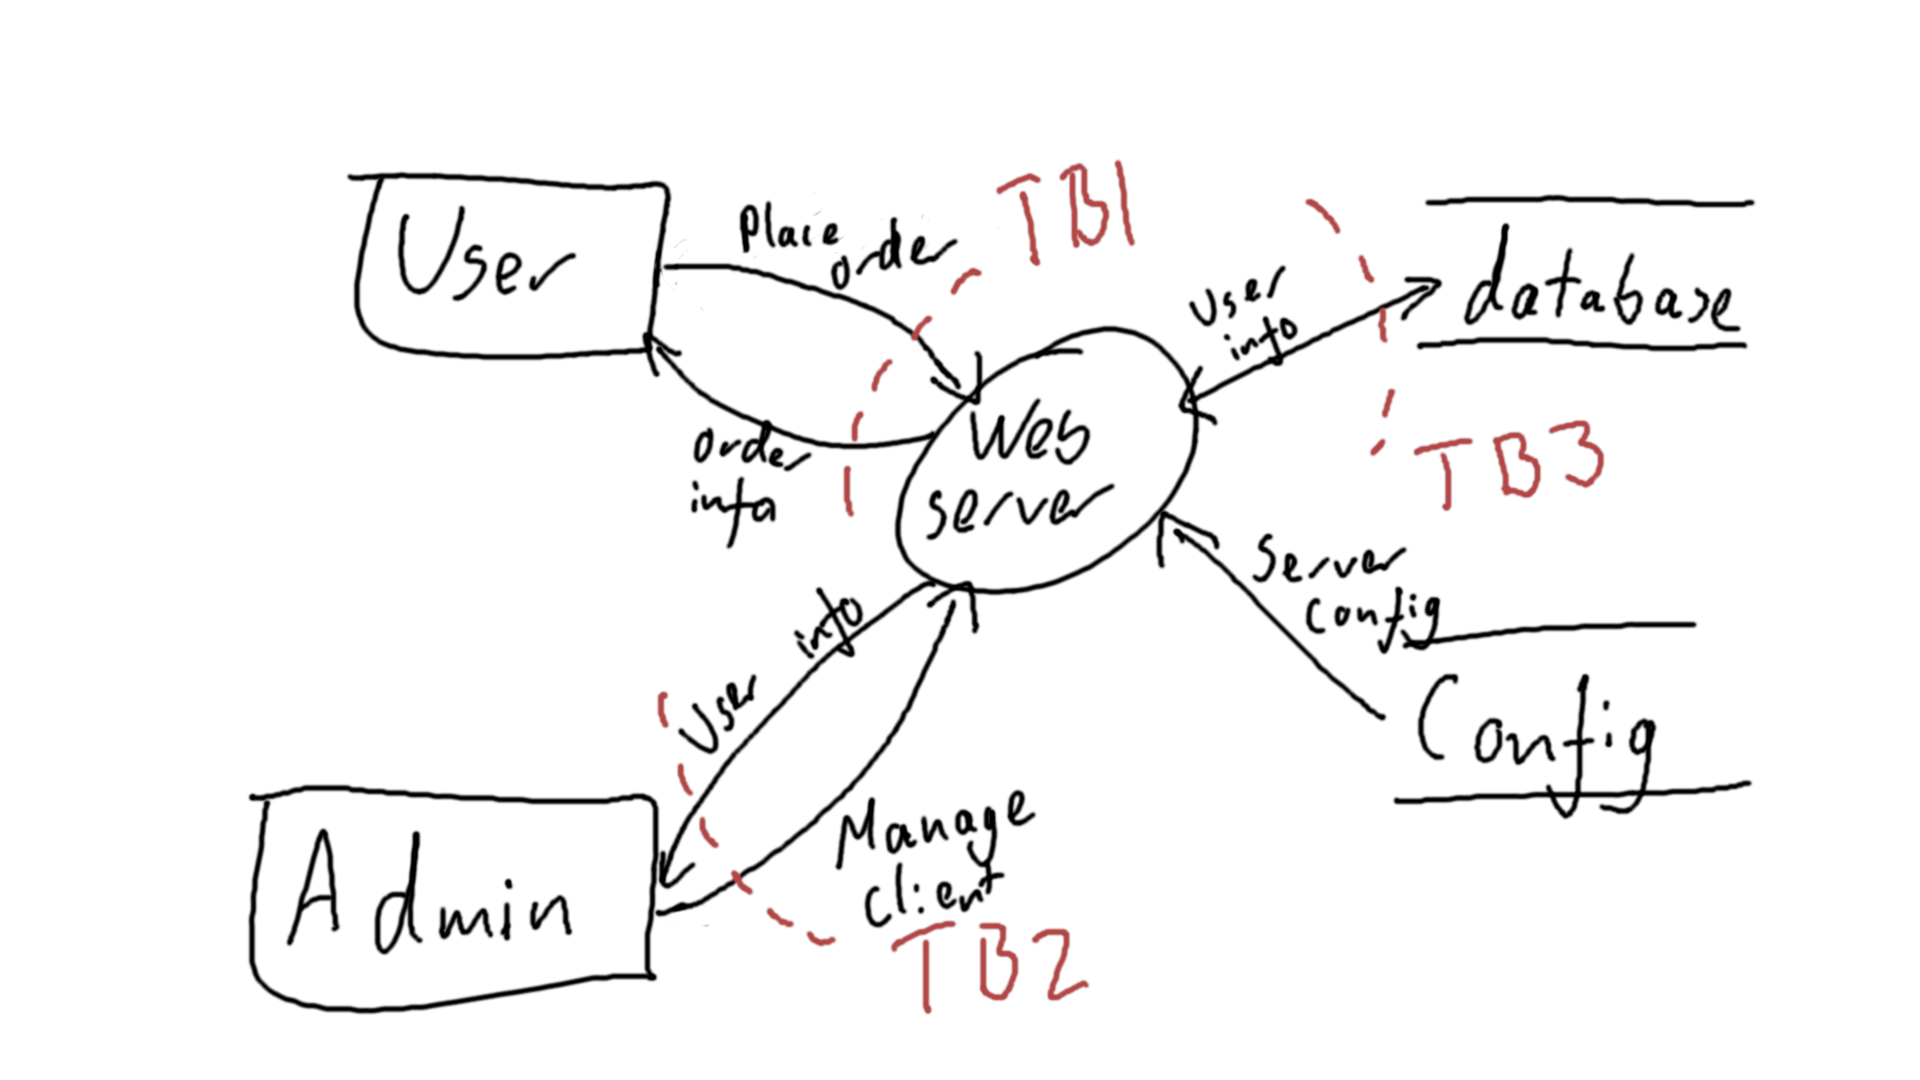
Prioritize Trust Boundaries
- Find a ranking
- Identify the most critical trust boundaries
- Analyze those first
Ranking Proposition
| Component | Description | Points |
|---|---|---|
| Exposed | Located or crossing a non-trusted boundary area | +3 |
| Compliance | Subject to regulatory compliance | +2 |
| Third Party | Hosted/Operated by a third part | +2 |
| Hostile | Should be considered as a high source of hostility | +2 |
| HA | Subject to High Availability requirements | +1 |
| Static | As is/not changing | -2 |
| Trusted | Operates in a trusted environment | -1 |
Example
| TB1 | TB2 | TB3 | |||
|---|---|---|---|---|---|
| HA | +1 | Compliance | +2 | HA | +1 |
| Compliance | +2 | Third Party | +2 | Trusted | -1 |
| Exposed | +3 | Hostile | +2 | ||
| Trusted | -1 | ||||
| Total: | 6 | Total: | 5 | Total: | 0 |
TASK!!!
Create a ranking for each trust boundary in your diagram
Identify Threats
STRIDE
- Spoofing
- Tampering
- Repudiation
- Information disclosure
- Denial of service
- Elevation of privilege
Spoofing
Impersonating someone, or something else
- Use others username/password
- Phising
- Man in the middle
Tampering
Modifying data or code
- Modifying a library on a system
- Modifying a configuration file
- Alter data in transit
Repudiation
Claiming not to have performed an action
- I never sent that email
- “No honey, I never visited that site”
- Removing audit trails
Information Disclosure
Revealing information to unauthorized parties
- Gaining access to read a database directly
- Reading a file on a system
- Reading network traffic
Denial of Service
Deny or degrade service to legitimate users
- Crashing the system
- Denying network access to the system
- Making a service unreachable or unusable
Elevation of Privilege
Gaining capabilities without proper authorization
- Gaining root access to a system
- Allowing a remote user to execute code
- Compromising a system
- Gaining unauthorized access to information
Apply to each adjacent element to a trust boundary
| S | T | R | I | D | E | |
|---|---|---|---|---|---|---|
| External Entity | Y | Y | ||||
| Process | Y | Y | Y | Y | Y | Y |
| Data Store | Y | ? | Y | Y | ||
| Data Flow | Y | Y | Y |
Example
Example
| User | <-> | Web Server | ||||
|---|---|---|---|---|---|---|
| TB1 | Mitigations | Vulnerabilities | Mitigations | Vulnerabilities | Mitigations | Vulnerabilities |
| S | Username/Password | No 2FA | TLS w/cert | |||
| T | TLS | No input validation | ||||
| R | No Audit Trail | Missing user action logging | ||||
| I | TLS | No input validation No Stored Procedures | ||||
| D | Single ISP | Load balanced | ||||
| E | Access Control |
TASK!!!
Identify threats for each trust boundary in your diagram
Counter Measures
Risk ranking
- CVSS score
- Security Bug Bars
- OWASP Risk Rating
CVSS Score
- Common Vulnerability Scoring System
- Standardized scoring system
- Has an online calculator
- Complex and a bit overkill
- Used when we get vulnerabilities reported
Security Bug Bars
- Evolution of DREAD
- Used by Microsoft
- Simple and easy to use
- Does not care about likelyhood/ease of attack
Example
| STRIDE Value | Client/Server | Scope | Severity |
|---|---|---|---|
| Spoofing | Client | Attacker present a UI visually identical to one the user uses to make trust decisions in common scenarios | Important |
| Attacker presents a UI visually identical to one the user is accustomed to trust in specific scenarios | Moderate | ||
| Server | Computer connecting to server is able to masquerade as a different user or computer of choice using a protocol designed to provide strong authentication. | Important | |
| Tampering | Client | Permanent modification of any user data or data used to make trust decisions in a common scenario that persists after restarting the OS/application | Important |
OWASP Risk Rating
- Point scoring system
- Takes into account the likelyhood
Scoring
| Score | Attack Vector | Prevalence | Detectability | Impact |
|---|---|---|---|---|
| 3 | Easy | Widespread | Easy | Severe |
| 2 | Average | Common | Average | Moderate |
| 1 | Difficult | Uncommon | Difficult | Minor |
\[ score = \frac{Vector + Prevalence + Detectability}{3} * Impact \]
Example
| Threat | Attack Vector | Prevalence | Detectability | Impact | Score | Risk |
|---|---|---|---|---|---|---|
| T1 | 3 | 3 | 2 | 3 | 8.0 | High |
| T2 | 1 | 2 | 2 | 1 | 1.67 | Low |
| T3 | 2 | 3 | 3 | 2 | 5.33 | Medium |
\[ Low: x \leq 3 Medium: 3 < x \leq 6 High: 6 < x \]
TASK!!!
Assess the risk of each threat found